I have now reached the Data Cleaning in R section of DataQuest’s Data Analyst in R track. I had some difficulty finding a messy data set to clean. I decided to practice cleaning two datasets.
I’ll first discuss the first data set which comes from UCI Machine Learning Repository. In the repository, I found the Purchasing Intention Data Set. This data set explores the intentions of online shoppers using metrics like Bounce Rate and Traffic Type.
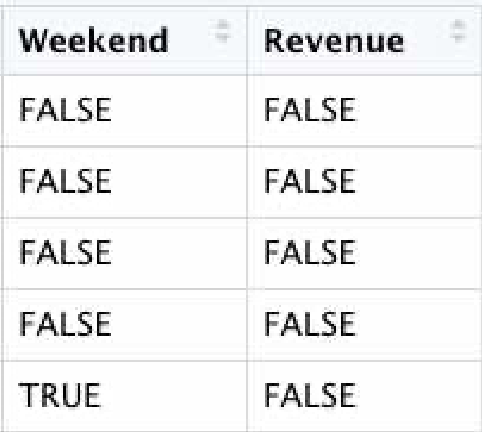
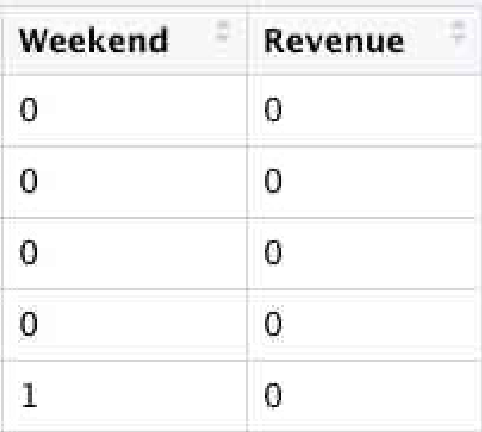
The first thing I wanted to do was to convert the columns Weekend and Revenue from logical(TRUE/FALSE) columns to numeric columns. There are a few ways to do this as shown in the screenshot below.
# Converting a single column to numeric:
online_shoppers_number <- online_shoppers_intention %>%
  mutate(`Weekend` = as.numeric(`Weekend`))
# Converting multiple columns to numeric with column names:
online_shoppers_number <- online_shoppers_intention %>%
  mutate_at(vars(Weekend, Revenue), as.numeric)
# Converting multiple columns to numeric with column indexes:
online_shoppers_number <- online_shoppers_intention %>%
  mutate_at((17:18), as.numeric)
I decided to use the second script to convert the Weekend and Revenue columns to numeric columns. The first photo shown is before I converted the columns to numeric and the second photo shows the columns after I converted them to numeric columns.
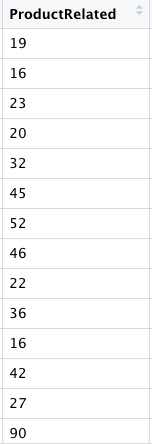
The next thing I decided to do was to filter the data frame so that values for the ProductRelated column are more than 15. The ProductRelated column refers to products pages of a shopping site. I filtered the data using the script shown below.
online_shoppers_number <-online_shoppers_number %>%
  filter(ProductRelated > 15)
This is what the column looked like after I filtered it:
I then decided to group the data by Month and Visitor Type and sum up the columns using Informational and Informational Duration columns.
The results are shown below.
online_shoppers_group <- online_shoppers_number %>%
  group_by(`Month`, `VisitorType`)
online_shoppers_informational <- online_shoppers_group %>%
  mutate(`Informational_Total` = `Informational` + `Informational_Duration`)

online_shoppers_informational
# A tibble: 6,726 x 19
# Groups:   Month, VisitorType [22]
   Administrative Administrative_… Informational Informational_D…
            <dbl>            <dbl>         <dbl>            <dbl>
 1              0              0               0                0
 2              0              0               0                0
 3              2             53               0                0
 4              0              0               0                0
 5              4             64.6             0                0
 6              1              6               1                0
 7              0              0               0                0
 8              1              9               0                0
 9              0              0               0                0
10              4             56               2              120
# … with 6,716 more rows, and 15 more variables:
#   ProductRelated <dbl>, ProductRelated_Duration <dbl>,
#   BounceRates <dbl>, ExitRates <dbl>, PageValues <dbl>,
#   SpecialDay <dbl>, Month <chr>, OperatingSystems <dbl>,
#   Browser <dbl>, Region <dbl>, TrafficType <dbl>,
#   VisitorType <chr>, Weekend <dbl>, Revenue <dbl>,
#   Informational_Total <dbl>
Next, I wanted to filter and select variables from a data frame.
online_shoppers_select <- online_shoppers_informational %>%
  filter(Region == "3"  & Browser == "2") %>%
  select(`Month`, `VisitorType`, `OperatingSystems`, `Browser`, `Region`)
online_shoppers_select
# A tibble: 891 x 5
# Groups: Month, VisitorType [17]
Month VisitorType OperatingSystems Browser Region
<chr> <chr> <dbl> <dbl> <dbl>
1 Feb Returning_Visitor 2 2 3
2 Feb Returning_Visitor 3 2 3
3 Feb Returning_Visitor 2 2 3
4 Mar Returning_Visitor 2 2 3
5 Mar Returning_Visitor 2 2 3
6 Mar Returning_Visitor 2 2 3
7 Mar Returning_Visitor 2 2 3
8 Mar Returning_Visitor 2 2 3
9 Mar Returning_Visitor 2 2 3
10 Mar Returning_Visitor 2 2 3
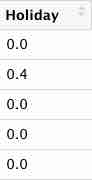
# … with 881 more rowsI decided to change the name of the Special Day column to Holiday using the rename function.
online_shoppers_informational <- online_shoppers_informational %>%
  rename(Holiday = SpecialDay)
This is what the SpecialDay column looked like after I changed its name to Holiday.
Lastly with this data frame, I decided to look for duplicate values.
duplicated(online_shoppers_select)[1:10]
[1] FALSE FALSE TRUE FALSE TRUE TRUE TRUE TRUE TRUE TRUEThe problem with this approach is the output of duplicated() is a vector and I’d have to search for the values that are TRUE. I would have to index the vector to get the values that are duplicates. This method is not ideal, especially if I’m working with multiple data frames.
Another Method of Finding Duplicates
There is another way to look for duplicated values. I can combine the duplicated() function with the purrr functionals and dplyr to look for duplicated values.
For this example, I’ll use two data frames I created myself.
The first step is to create a list of the data frames so I can use a functional to perform the same operation on each data frame.
baby_traffic <- data.frame(Browser = c("Windows", "macOS", "Linux", "Android", "iOS"),
                    Region = c("North America", "South America", "Africa", "Asia", "South America"),
                    TrafficType = c(1, 1, 3, 4, 4))


men_traffic <- data.frame(Browser = c("Windows", "macOS", "Linux", "Android", "iOS"),
                         Region = c("Africa", "South America", "Africa", "Asia", "Europe"),
                         TrafficType = c(0, 2, 1, 3, 0))
traffic <-list(baby_traffic, men_traffic)
I’ll then use the map() functional and mutate() function to create a new column with the logical output of duplicated(). This will allow me to filter the data frame to return rows where the values of duplicated column are TRUE. When I call dup_traffic, you can see here that duplicates have been identified in the TrafficType column.
dup_traffic<- traffic %>%
  map(mutate, is_dup = duplicated(TrafficType))
dup_traffic
[[1]]
  Browser        Region TrafficType is_dup
1 Windows North America           1  FALSE
2   macOS South America           1   TRUE
3   Linux        Africa           3  FALSE
4 Android          Asia           4  FALSE
5     iOS South America           4   TRUE

[[2]]
  Browser        Region TrafficType is_dup
1 Windows        Africa           0  FALSE
2   macOS South America           2  FALSE
3   Linux        Africa           1  FALSE
4 Android          Asia           3  FALSE
5     iOS        Europe           0   TRUE
I have to admit this was a pretty difficult section but I’m glad I’m learning it! That’s all for Data Cleaning for now. Until next time…